Dust Control Theory
Dust Particle Sizes
The size of a dust particle is important as it provides a guide to its behaviour and occupational risk:- smaller and lighter the particles will travel further in the wind
- particles below 25 micron are not visible to the human eye
- particles below 10 micron are easily be inhaled into the lungs
- particles below 5 micron can get permanently lodged in the lungs increasing the potential for respiratory illness

Image taken from: http://www.filtercorp.biz/
A key point here is that visible dust is not a major concern for health, but it is the smaller particles that are generated at the same time. These may not be visible but will travel further and are the major health issue for the community. As a result most dust monitoring is usually focused on the PN10 dust (less than 10 micron) particles.
Dust Extinction Moisture (DEM)
The Dust Extinction Moisture (DEM) level provides a guide on the moisture level required to minimise dust when processing material. In practice the graph of dust vs moisture level of a material is more useful as it illustrates the impact of adding moisture to the ore. This allows organisations to select an acceptable dust level and an associated target moisture level. The graph produced to determine a DEM are usually logarithmic.Read more at: http://www.amsj.com.au/news/health/settling-the-dust-how-much-is-too-much/ | Australasian Mine Safety
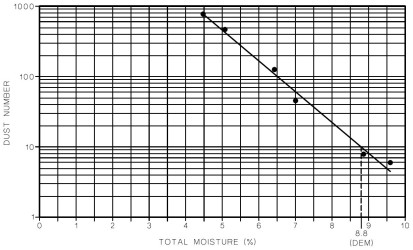
Image taken from: https://www.amsj.com.au/settling-the-dust-how-much-is-too-much/
It is important to understanding the behaviour of the material with different moisture levels. For example when increasing the moisture level of some materials they will become sticky or clump before they reach their DEM. For these materials this stickiness will cause cause problems with handling of the material, and hence the target moisture level will need to be higher than where this becomes an issue.
Material Handling Design
The design of material handling systems can impact the amount of dust generated. The following are some of the key points in material handling design:- avoids the direct impact of material on chute surfaces - guide the stream
- minimise material free falling - again guide the stream
- when transferring material between belts try to match the material velocity with the belt speed
Dust Lift Off
| Material | Density | 1 Micron Particle | 10 Micron Particle | 100 Micron Particle |
| Coal | 800 kg/m3 | 0.8 m/s | 2.6 m/s | 8.3 m/s |
| Dirt | 1300 kg/m3 | 1.1 m/s | 3.4 m/s | 10.6 m/s |
| Iron Ore | 2200 kg/m3 | 1.4 m/s | 4.4 m/s | 13.8 m/s |
| Lead | 3200 kg/m3 | 1.7 m/s | 5.3 m/s | 16.6 m/s |

Image taken from: http://ro.uow.edu.au/cgi/viewcontent.cgi?article=2949&context=eispapers
Dust time in air and dust travel distance
The time dust particles hang in the air and the distance they travel is important to understand because visible dust (> 25 micron) falls to the ground quicker and does not travel the same distances as PN10 dust. The following table provides theoretical fall time in air and travel distance for dust particles of different sizes and densities. The table uses a 10m starting height for the dust particle and a 1m/s wind speed (3.6 km/hr).
| Material | Density | 1 micron 1 m/s wind 10m off ground | 10 micron 1 m/s wind 10m off ground | 100 micron 1 m/s wind 10m off ground | |||
| Time | Distance | Time | Distance | Time | Distance | ||
| Coal | 800 kg/m3 | 4.8 days | 400 km | 70 min | 4.1 km | 41 sec | 40 m |
| Iron Ore | 2,200 kg/m3 | 42 hrs | 150 km | 25 min | 1.5 km | 15 sec | 15 m |
| Lead | 3,200 kg/m3 | 29 hrs | 100 km | 17 min | 1.0 km | 10 sec | 10 m |
The table can be used to estimate travel distances for sources of dust because a change in height or wind speed impacts the time in the air and the travel distance proportionally. For example, particles from a source which creates a plume of dust 5m high or a 5m high stockpile will have half the time in the air and half the travel distance to that shown in the table. If you want to understand the travel time of a particle in 3m/s (10.8 km/hr) wind then multiple the values in the table by 3.
Matching Water Droplet Size with Dust Particle Size
Dust particles join with water droplets of the same size much more efficiently. This is due to the air stream that occurs at the surface of the dust particle and water droplet. The larger the particle/droplet the thicker the air stream and the further it protrudes from the surface. When there is a mismatch in particle/droplet sizes it is much harder for the smaller particle/droplet to push through the air stream of the larger particle. The following image demonstrates this.
Image Source: http://www.spray.com.au/Literature_PDFs/B652_Dust_Control.pdf
Water droplet surface area & droplet numbers
| Droplet Size | Droplet Surface Area | Droplet Number |
| 10 micron | 600 m2 | 1.9 trillion |
| 30 micron | 200 m2 | 71 billion |
| 100 micron | 60 m2 | 1.9 billion |
| 300 micron | 20 m2 | 71 million |
| 1 mm | 6 m2 | 1.9 million |
Water droplet size by spray nozzle type
Water droplets discharged from nozzles have sizes usually in a typical bell curve (curve max is at centre and falls away at sides). Dust particles also come in a range of sizes and their distribution can be very different to a bell curve as the following real example shows.
The selection of spray nozzles for an application should take into consideration the dust particle size distribution. The following extract from the Spraying Systems: A Guide to Spray Technology for Dust Control illustrates the key considerations when selecting a nozzle.

It is important to note that matching the nozzle droplet size to the dust particle size is only applicable where the nozzle discharge is close to the dust source. A good example of this is Fog Cannons where the discharge droplet size needs to be larger as the droplet reduces size as it travels due to water droplet break up and evaporation.
Hydrophobic Dust Material
Some dust types are hydrophobic - the dust particles repel the water droplets. Dust can be hydrophobic to various degrees. When dust is hydrophobic it is harder to increase the material DEM and also makes mist or fog based dust suppression less effective.Wetting agents and agents with ionic charges can be used to reduce the hydrophobic effects of dust. A simple test can be used to see if wetting agents will make a difference. Have 2 glasses of water and put a couple of drops of wetting agent (eg quality dishwashing detergent) into one and gently mix it without creating froth. Sprinkle a small amount of fine dust on the water surface of both glasses and see if there is any different in the time the dust takes to sink. If the dust just sits on the surface and does not sink then it is hydrophobic.
If you have a particular dust control application you would like to discuss or would like more information then please call us on +61 2 6062 3300 or send an email to sales@wetearth.com.au.